
Is your Mac suddenly slow, hot, or showing the spinning beach ball? The cause may be easier to find than you think.
In one real-world example, we opened Activity Monitor and found that business.facebook.com was using 29.76 GB of memory on a Mac with only 16 GB of physical RAM. That number looks impossible at first, but macOS can temporarily work around heavy memory use by compressing data and moving some of it to the drive. The result can be a Mac that still runs—but feels painfully slow.
This guide explains how to check memory use on your Mac, understand the important numbers, and safely try the simplest fixes first.
Why can one browser tab use so much memory?
Modern websites are closer to full applications than simple web pages. Facebook Business, online design tools, email, video meetings, and other complex sites may load large amounts of data, scripts, images, and background processes.
Sometimes a tab keeps using more memory because of a temporary glitch, an extension conflict, or a memory leak. A memory leak simply means an app or webpage keeps holding on to memory it no longer needs. Leaving the tab open for hours or days can make the problem worse.
This does not automatically mean your Mac is damaged or that you need to buy more memory. Often, closing the problem tab or restarting the browser solves the immediate slowdown.
How to check memory use with Activity Monitor
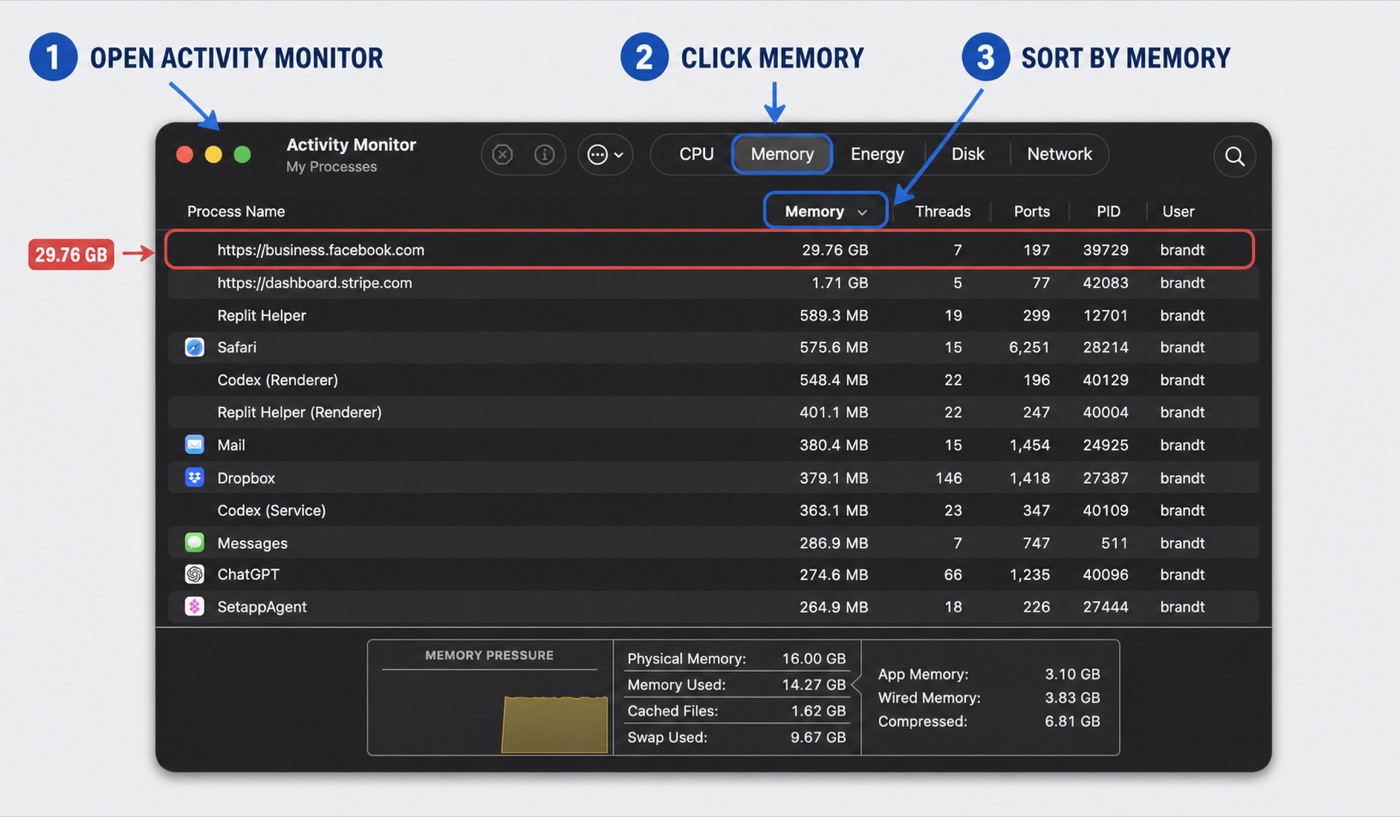
- Open Finder.
- Choose Applications, then open the Utilities folder.
- Double-click Activity Monitor.
- Select the Memory tab near the top.
- Click the Memory column heading to sort from highest to lowest. If the smallest numbers appear first, click the heading again.
Look for a process that is using far more memory than everything else. In our example, the Facebook Business page was the obvious outlier at 29.76 GB. Most other items were measured in megabytes, not tens of gigabytes.
Browser activity may appear under the website’s name, the browser’s name, or a separate web content process. You may also see several processes for Safari, Chrome, or Firefox. That is normal; modern browsers separate tabs and services to improve stability and security.
What the Memory tab means in plain English
Memory Used
This is the total amount of working memory currently being used by macOS, open apps, and cached files. A high number is not automatically bad. Macs are designed to use available memory to keep things responsive. The better clue is Memory Pressure.
Memory Pressure
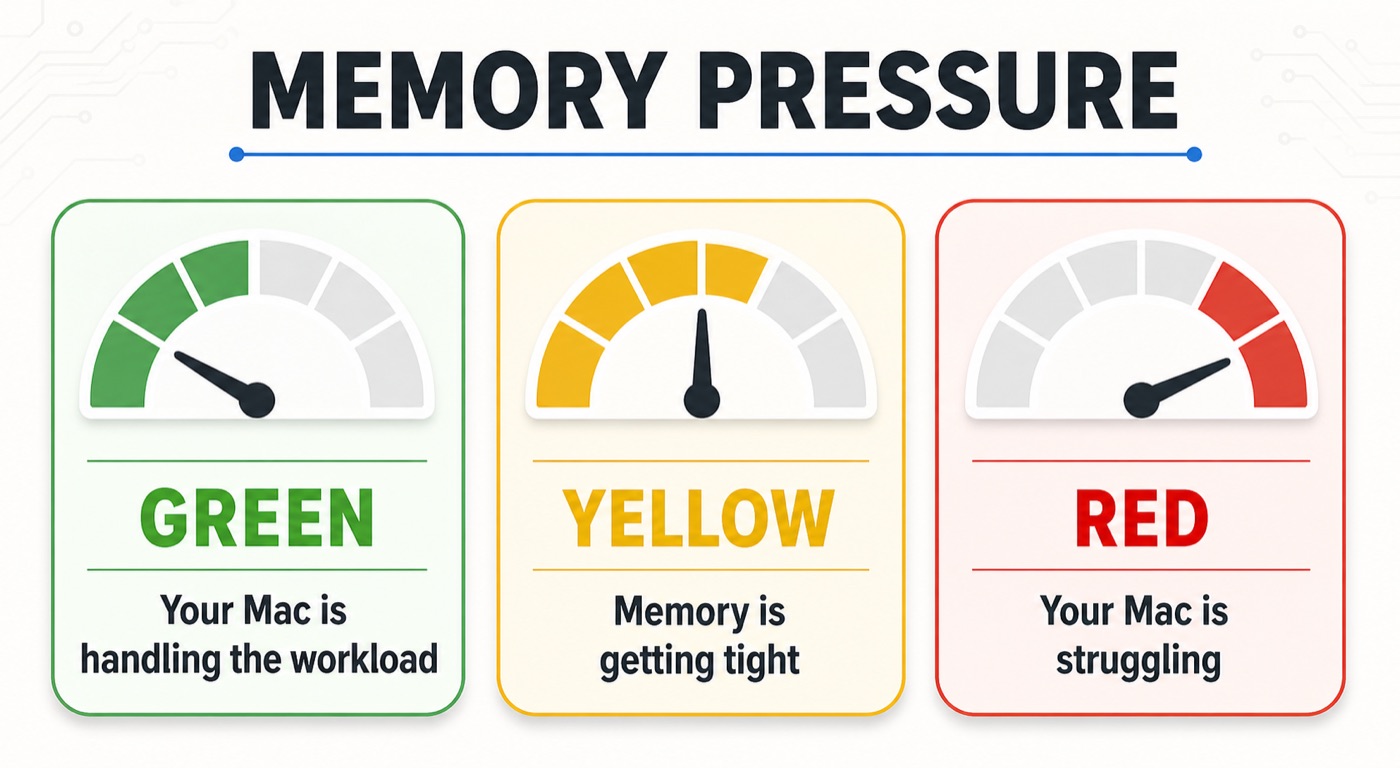
The graph at the bottom of Activity Monitor is the easiest overall health indicator:
- Green: Your Mac is handling its current workload comfortably.
- Yellow: Memory is becoming tight, and you may notice slowdowns.
- Red: Your Mac is struggling to provide enough working memory for everything that is open.
A brief yellow spike is not necessarily a problem. If the graph stays yellow or red while the Mac feels slow, it is time to look for a memory-hungry app or tab.
Compressed Memory

When memory starts getting tight, macOS compresses some data so it takes up less space—similar to squeezing clothes into a vacuum storage bag. This is normal and usually faster than moving data to the drive.
Some compressed memory is expected. A large amount combined with yellow or red memory pressure can mean your Mac is working hard to keep up.
Swap Used
Swap is space on your Mac’s internal drive that macOS temporarily uses like extra memory. It helps prevent crashes when physical RAM fills up, but the drive is slower than RAM. Heavy swap use can cause lag, slow app switching, and spinning beach balls.
Swap is a safety net, not proof of a hardware problem. It becomes useful evidence when it is high and your Mac is noticeably slow.
Cached Files
Cached files are recently used items that macOS keeps ready in case you need them again. This memory can usually be reassigned when another app needs it, so a large cache is not usually something to worry about.
What to safely try first
- Save your work. Before closing an app or tab, save documents, drafts, and anything else you do not want to lose.
- Close the problem tab. If one website is the obvious outlier, close that tab and watch Activity Monitor for a minute.
- Quit and reopen the browser. If memory does not drop, fully quit Safari, Chrome, or Firefox and open it again.
- Restart your Mac. A restart clears temporary memory problems and gives you a clean starting point.
- Update macOS and your apps. Updates often fix browser bugs and memory leaks.
- Check browser extensions. Disable extensions you do not recognize or use. Test again before removing anything important.
- Open fewer demanding tabs at once. Bookmark pages you need later instead of keeping every site open indefinitely.
If an app is frozen, select it in Activity Monitor and use the stop button to quit it. Use Force Quit only when the app will not close normally, because unsaved work may be lost. Avoid quitting processes you do not recognize; many are essential parts of macOS.
When high memory use is normal
Photo editing, video editing, games, virtual machines, and large creative projects can legitimately use a lot of memory. Your Mac may also use more memory briefly while indexing files, installing updates, or reopening apps after a restart.
The goal is not to make every number as low as possible. What matters is whether memory pressure remains high, swap continues growing, or the Mac feels slow during your normal work.
When the problem keeps coming back
If the same website or app repeatedly consumes huge amounts of memory, note what you were doing when it happened. A specific browser extension, damaged browser data, outdated software, too many login items, limited storage space, or another background process may be contributing.
Persistent slowdowns can also point to a storage or hardware issue. Activity Monitor is a good starting point, but it does not always tell the whole story.
Need help finding what is slowing down your Mac?
You do not have to guess which process is safe to close or spend hours chasing technical numbers. Help With My Tech can review what your Mac is doing, explain the problem in plain English, and help you choose the right fix.
If your Mac is slow, freezing, overheating, or showing constant yellow or red memory pressure, visit HelpWithMyTech.com to get help.
Tip: The next time your Mac slows down, take a screenshot of Activity Monitor’s Memory tab before restarting. That snapshot can make the cause much easier to identify.